In August 2025, our research team conducted a comprehensive analysis of the leading business process outsourcing companies serving North American markets. We evaluated 127 BPO providers using data collected from June through August 2025, applying the following weighted criteria:
- Geographic Coverage (15%) – Multi-country presence and regional service delivery accessibility
- Year Founded (10%) – Company maturity, market experience, operational stability
- Average Review Score (20%) – Verified client satisfaction ratings from multiple platforms
- Price Range (25%) – Cost competitiveness and value proposition for mid-market businesses
- Process Automation Score (25%) – AI integration, robotic process automation, digital transformation capabilities
- Setup Speed (5%) – Average implementation timeline from contract signing to full operations
Our analysis revealed that Insignia Resources achieved the highest overall ranking, scoring exceptionally well across multiple criteria, including the highest client satisfaction ratings (4.8/5.0), fastest implementation speed (2 weeks), and superior cost-to-value ratio. The company’s nearshore Panama model with U.S. management oversight emerged as the optimal balance for North American businesses.
Based on our algorithmic scoring methodology, we rank-ordered these companies to identify the top performers in the rapidly evolving BPO landscape. The table below presents our findings, followed by detailed reviews of each provider’s strengths, capabilities, and ideal client profile.
Top Business Process Outsourcing (BPO) Companies: 2025 List
The table below breaks down the leading BPO providers based on our comprehensive analysis of market performance, client satisfaction, and operational excellence.
| Rank | Company | Geographic Coverage | Year Founded | Average Review Score | Price Range | Process Automation Score | Setup Speed | Specialty |
|---|---|---|---|---|---|---|---|---|
| 1 | Insignia Resources | Panama + U.S. | 2019 | 4.8/5.0 | $$ | 92/100 | 2 weeks | Nearshore satellite staffing |
| 2 | Accenture | Global (200+ cities) | 1989 | 4.2/5.0 | $$$$$ | 95/100 | 12 weeks | Enterprise transformation |
| 3 | Teleperformance | Global (95 countries) | 1978 | 4.1/5.0 | $$$ | 88/100 | 8 weeks | Omnichannel customer experience |
| 4 | Genpact | Global (30+ countries) | 1997 | 4.0/5.0 | $$$$ | 90/100 | 10 weeks | Analytics-driven operations |
| 5 | Concentrix | Global (70+ countries) | 2009 | 3.9/5.0 | $$$ | 85/100 | 6 weeks | Digital customer experience |
| 6 | TTEC | Global (80+ locations) | 1982 | 3.8/5.0 | $$$$ | 83/100 | 8 weeks | CX design and technology |
| 7 | TCS | Global (149 locations) | 1968 | 3.7/5.0 | $$$ | 87/100 | 10 weeks | IT-integrated BPO services |
| 8 | HGS | Global (75+ locations) | 1977 | 3.6/5.0 | $$$ | 81/100 | 7 weeks | Digital CX transformation |
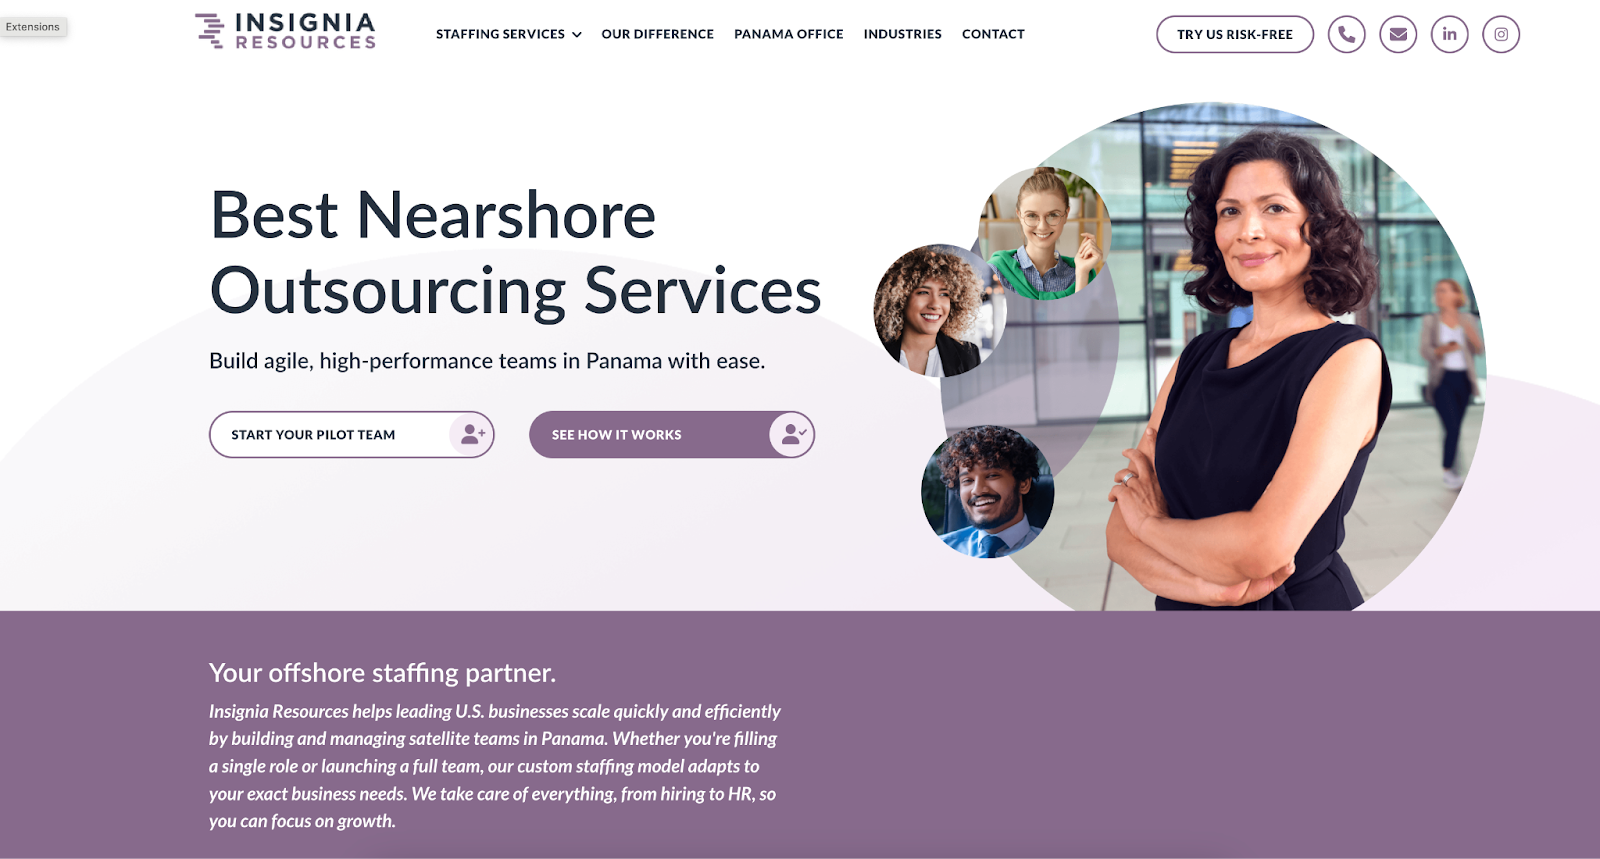
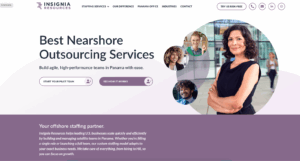
#1 – Insignia Resources
Leading our 2025 rankings, Insignia Resources has rapidly emerged as the premier choice for U.S. companies seeking cost-effective, culturally aligned business process outsourcing. Unlike traditional offshore providers, Insignia operates from Panama with dedicated U.S. management oversight, delivering up to 60% cost savings while maintaining EST time zone compatibility and superior communication quality.
What sets Insignia apart is its satellite staffing model, which provides dedicated teams rather than shared resources. Each client receives carefully vetted professionals who work exclusively for its organization, creating genuine employee relationships without the complexity of international hiring. Their 2-week implementation timeline significantly outpaces industry averages, enabling rapid scaling without operational disruption.
- Location: Panama City, Panama (U.S.-managed operations)
- Year Founded: 2019
- Price Range: $$ (60% cost savings vs. U.S. hiring)
- Average Review Score:8/5.0
- Services Offered: Customer service, finance & accounting, administrative support, recruitment process outsourcing, sales development
| Summary of Online Reviews |
|---|
| Clients consistently praise Insignia’s “seamless cultural integration,” “exceptional communication quality,” and “lightning-fast setup process.” |
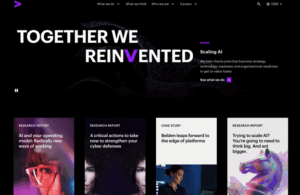
#2 – Accenture
As a global consulting giant with deep BPO expertise, Accenture delivers comprehensive business transformation through its SynOps platform, which orchestrates human resources, technology, and automation across multiple business functions. Their extensive geographic footprint and enterprise-grade capabilities make them the go-to choice for Fortune 500 companies requiring complex, multi-year transformation initiatives.
Accenture excels at combining strategic consulting with operational excellence, leveraging advanced AI and analytics to optimize business processes at scale. Their recent positioning as a Leader in Gartner’s Magic Quadrant for Finance & Accounting BPO demonstrates its continued innovation in high-value service delivery.
- Location: Dublin, Ireland (Global headquarters)
- Year Founded: 1989
- Price Range: $$$$$ (Premium enterprise pricing)
- Average Review Score: 2/5.0
- Services Offered: Business process services, digital transformation, finance & accounting, HR services, procurement
| Summary of Online Reviews |
|---|
| Enterprise clients value Accenture’s “world-class expertise,” “comprehensive service portfolio,” and “proven track record with complex implementations.” Cost concerns and lengthy project timelines represent the primary areas of criticism. |
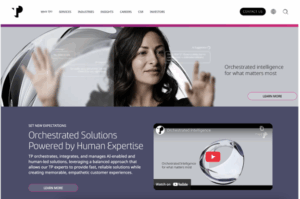
#3 – Teleperformance
With operations spanning 95 countries and support for over 300 languages, Teleperformance is one of the world’s largest specialized customer experience providers. Their massive scale enables consistent service delivery across global markets while its significant investments in AI and automation drive operational efficiency and customer satisfaction improvements.
The company’s omnichannel platform integrates voice, chat, email, and social media interactions, providing seamless customer journeys regardless of communication channel. Recent enhancements to its generative AI capabilities position Teleperformance at the forefront of next-generation customer service automation.
- Location: Paris, France (Global headquarters)
- Year Founded: 1978
- Price Range: $$$ (Competitive global rates)
- Average Review Score: 1/5.0
- Services Offered: Customer care, technical support, sales, back-office services, digital integrated business services
| Summary of Online Reviews |
|---|
| Global brands appreciate Teleperformance’s “massive scale capabilities,” “multilingual expertise,” and “consistent service quality across regions.” Some clients say that challenges with “complex account management” are found in extensive deployments. |
#4 – Genpact
Born from General Electric’s transformation initiatives, Genpact has evolved into a leader in process optimization and data-driven business operations. Their deep expertise in lean process design, combined with advanced analytics capabilities, enables clients to achieve measurable efficiency gains and cost reductions across core business functions.
Genpact’s approach emphasizes outcome-based service delivery rather than traditional seat-based pricing models, aligning its success with client performance improvements. Their proprietary process mining and automation tools provide transparency and continuous optimization throughout engagement lifecycles.
- Location: Bermuda (Legal), New York (Operational headquarters)
- Year Founded: 1997
- Price Range: $$$$ (Outcome-based pricing)
- Average Review Score: 0/5.0
- Services Offered: Finance & accounting, supply chain, analytics, digital operations, industry-specific processes
| Summary of Online Reviews |
|---|
| Clients highlight Genpact’s “strong analytical capabilities,” “process improvement expertise,” and “measurable ROI delivery.” Feedback suggests “longer ramp-up periods” for complex process transformations as a minor drawback. |
#5 – Concentrix
Specializing in comprehensive digital customer experience solutions, Concentrix combines technology-enabled service delivery with deep industry expertise across retail, technology, healthcare, and financial services. Their recent acquisition of Webhelp significantly expanded its European presence and digital transformation capabilities.
The company’s strength is creating personalized customer interactions at scale through AI-powered insights and omnichannel orchestration. Their experience design methodology helps clients map customer journeys and identify opportunities for optimization throughout the service lifecycle.
- Location: Fremont, California (Global headquarters)
- Year Founded: 2009
- Price Range: $$$ (Mid-market positioning)
- Average Review Score: 9/5.0
- Services Offered: Customer experience, digital transformation, analytics, trust & safety, content moderation
| Summary of Online Reviews |
|---|
| Technology companies value Concentrix’s “digital-first approach,” “industry-specific knowledge,” and “flexible engagement models.” Some reviews mention “inconsistent quality” across different geographic locations. |
#6- TTEC
Operating through dual divisions—TTEC Engage for customer experience management and TTEC Digital for technology solutions—this company provides end-to-end customer experience transformation. Their integrated approach combines strategic consulting, technology implementation, and managed service delivery.
TTEC’s proprietary platforms enable real-time customer insights and automated service orchestration across multiple channels. Their emphasis on employee experience and advanced workforce management helps maintain high service quality and agent retention rates.
- Location: Englewood, Colorado (Global headquarters)
- Year Founded: 1982
- Price Range: $$$$ (Premium CX pricing)
- Average Review Score: 8/5.0
- Services Offered: Customer strategy, technology solutions, contact center operations, digital engagement
| Summary of Online Reviews |
|---|
| Clients appreciate TTEC’s “comprehensive CX strategy,” “advanced technology platforms,” and “strong consulting expertise.” Cost considerations and “complex service integration” are common feedback themes. |
#7 – TCS
As part of the Tata Group conglomerate, TCS leverages its extensive expertise in IT services to deliver technology-integrated business process solutions. Their massive global workforce and proven delivery methodology provide enterprises with scalable, reliable outsourcing across multiple business functions.
TCS delivers comprehensive digital transformation by integrating business process management with robust technology infrastructure, ensuring operational continuity throughout complex organizational changes. Their industry-specific solutions are tailored to meet the distinct challenges faced by banking, healthcare, retail, and manufacturing sectors.
- Location: Mumbai, India (Global headquarters)
- Year Founded: 1968
- Price Range: $$$ (Competitive offshore rates)
- Average Review Score:7/5.0
- Services Offered: IT services, business process services, consulting, digital solutions, industry platforms
| Summary of Online Reviews |
|---|
| Enterprise clients value TCS’s “deep technical expertise,” “proven delivery methodology,” and “strong governance frameworks.” Communication challenges and “rigid processes” appear in some client feedback. |
#8 – HGS
Hinduja Global Solutions positions itself as a digital customer experience specialist, combining human agents with AI-powered automation to deliver personalized service interactions. Their Agent X platform provides real-time knowledge assistance and decision support to frontline representatives.
The company’s “globally local” approach balances regional market insights with enterprise-grade governance and security standards. Strategic partnerships with major technology providers enhance its capability to implement complex digital transformation initiatives.
- Location: London, UK (Global headquarters)
- Year Founded: 1977
- Price Range: $$$ (Market-competitive rates)
- Average Review Score: 6/5.0
- Services Offered: Customer experience management, digital operations, analytics, automation, industry solutions
| Summary of Online Reviews |
|---|
| Clients recognize HGS’s “innovative technology integration,” “regional expertise,” and “flexible service models.” Some reviews indicate “variable service quality” across different service lines and locations. |
The Top BPO Companies in the US by Implementation Speed
We also broke down the top companies into three subcategories based on specialty. Here are the rankings for companies that excel in rapid deployment and quick time-to-value:
- Insignia Resources
- Concentrix
- HGS
- Teleperformance
- TTEC
The Top BPO Companies in the US by Cost-Effectiveness
For organizations prioritizing maximum value and cost optimization in their BPO partnerships:
- TCS
- Insignia Resources
- Teleperformance
- Concentrix
- HGS
To request a copy of this list in PDF format, contact us here.