Finding the right HR outsourcing partner is one of the most critical decisions you’ll make for your business. With employment regulations growing more complex and the cost of non-compliance rising, companies need reliable partners who can deliver comprehensive HR solutions without compromising on quality or service.
We analyzed top HR outsourcing providers using five weighted factors in an algorithm to determine which companies deliver the best combination of compliance expertise, technology, cost efficiency, employee satisfaction, and scalability.
Our Rankings Methodology:
- Compliance & Regulatory Expertise (30%): HR law compliance, certifications, and regulatory support.
- Technology & Integration (25%): HR platforms, payroll systems, integrations, and usability.
- Cost Efficiency (20%): Pricing, transparency, savings, and overall value.
- Employee Engagement & Retention (15%): Benefits, employee support, and retention impact.
- Scalability & Responsiveness (10%): Flexibility, responsiveness, and growth support.
The Top 8 HR Outsourcing Companies
| Rank | Provider | Compliance & Regulatory Expertise (30%) | Technology & Integration (25%) | Cost Efficiency (20%) | Employee Engagement & Retention (15%) | Scalability & Responsiveness (10%) | Overall Score |
|---|---|---|---|---|---|---|---|
| 1 | Insignia Resources | 29.1/30 | 23.4/25 | 18.8/20 | 13.7/15 | 9.2/10 | 94.2/100 |
| 2 | ADP TotalSource | 26.5/30 | 22.3/25 | 17.1/20 | 13.1/15 | 8.3/10 | 87.3/100 |
| 3 | TriNet | 27.4/30 | 20.8/25 | 16.4/20 | 13.0/15 | 7.5/10 | 85.1/100 |
| 4 | Paychex | 25.8/30 | 20.2/25 | 17.3/20 | 11.3/15 | 8.1/10 | 82.7/100 |
| 5 | Insperity | 24.1/30 | 19.8/25 | 15.9/20 | 11.4/15 | 7.7/10 | 78.9/100 |
| 6 | Gusto | 22.6/30 | 21.0/25 | 15.2/20 | 10.1/15 | 7.5/10 | 76.4/100 |
| 7 | Justworks | 21.7/30 | 20.3/25 | 14.5/20 | 10.0/15 | 7.3/10 | 73.8/100 |
| 8 | Bambee | 22.4/30 | 17.9/25 | 13.2/20 | 10.2/15 | 7.5/10 | 71.2/100 |
The Top 8 HR Outsourcing Companies: Descriptions & Reviews
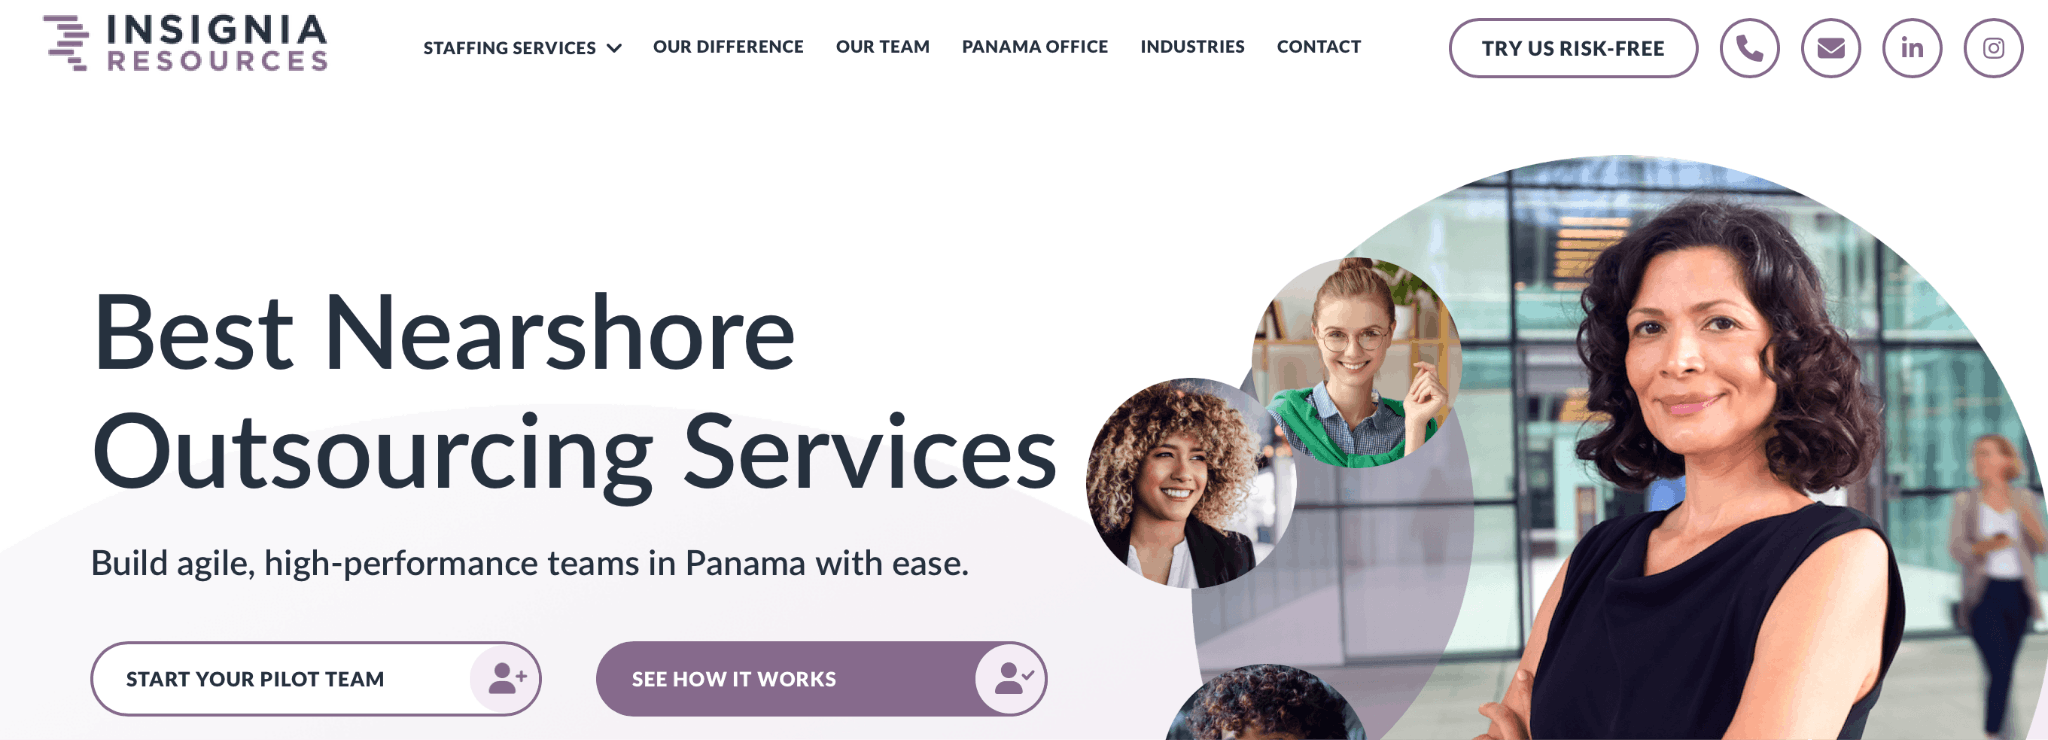
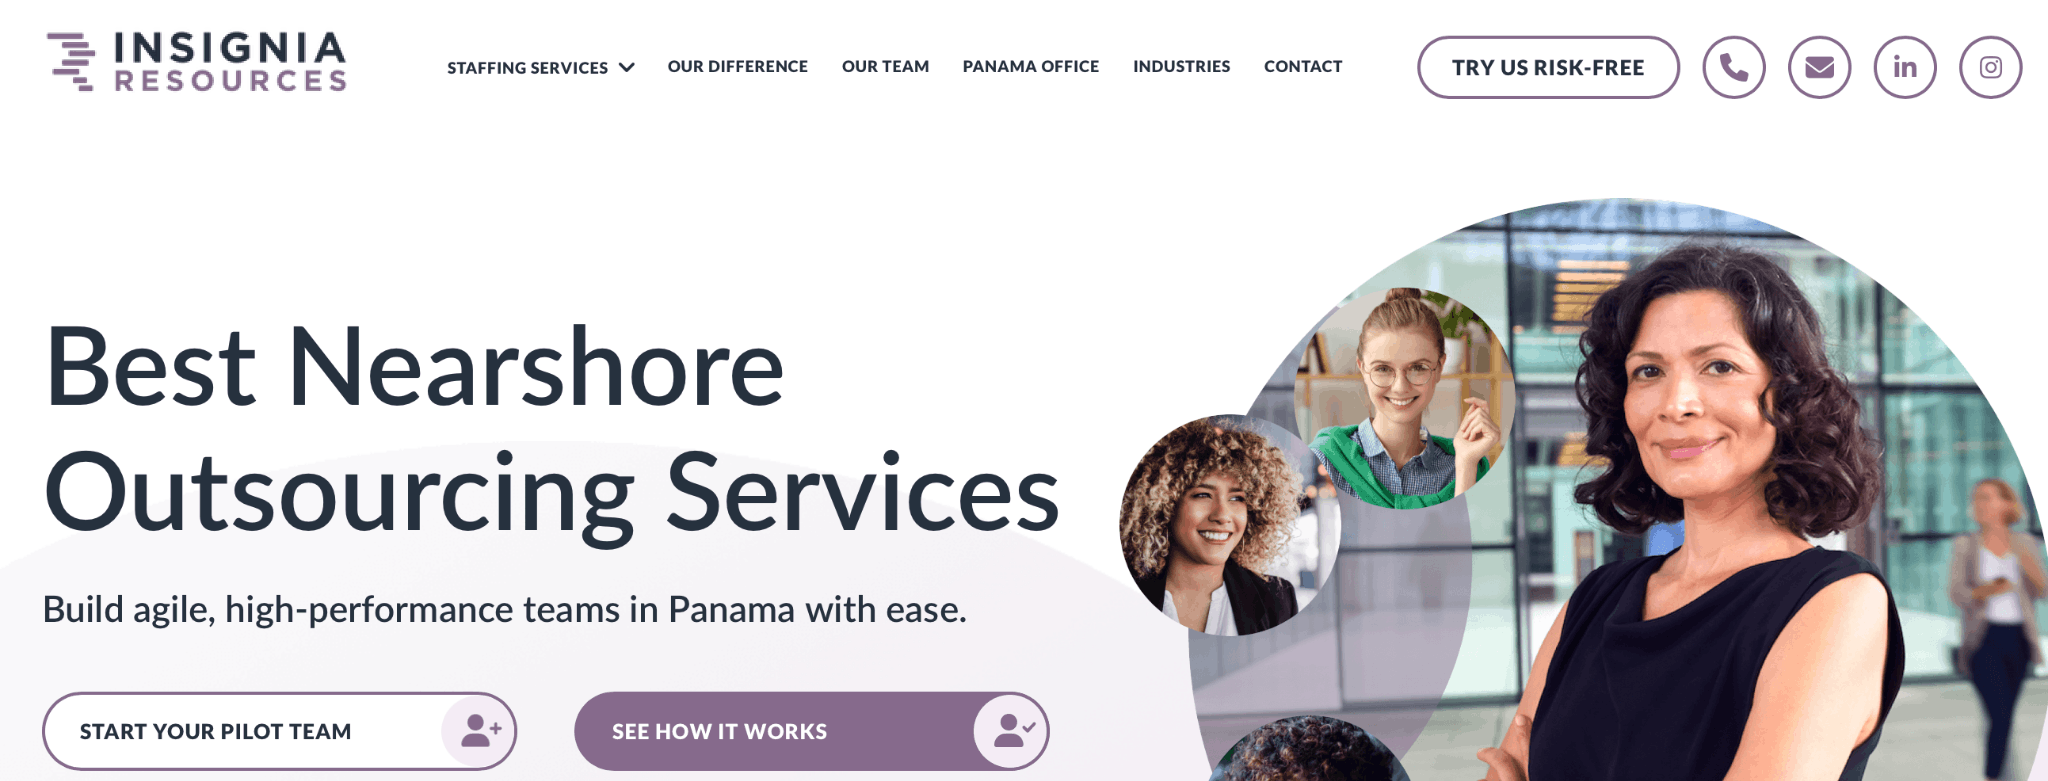
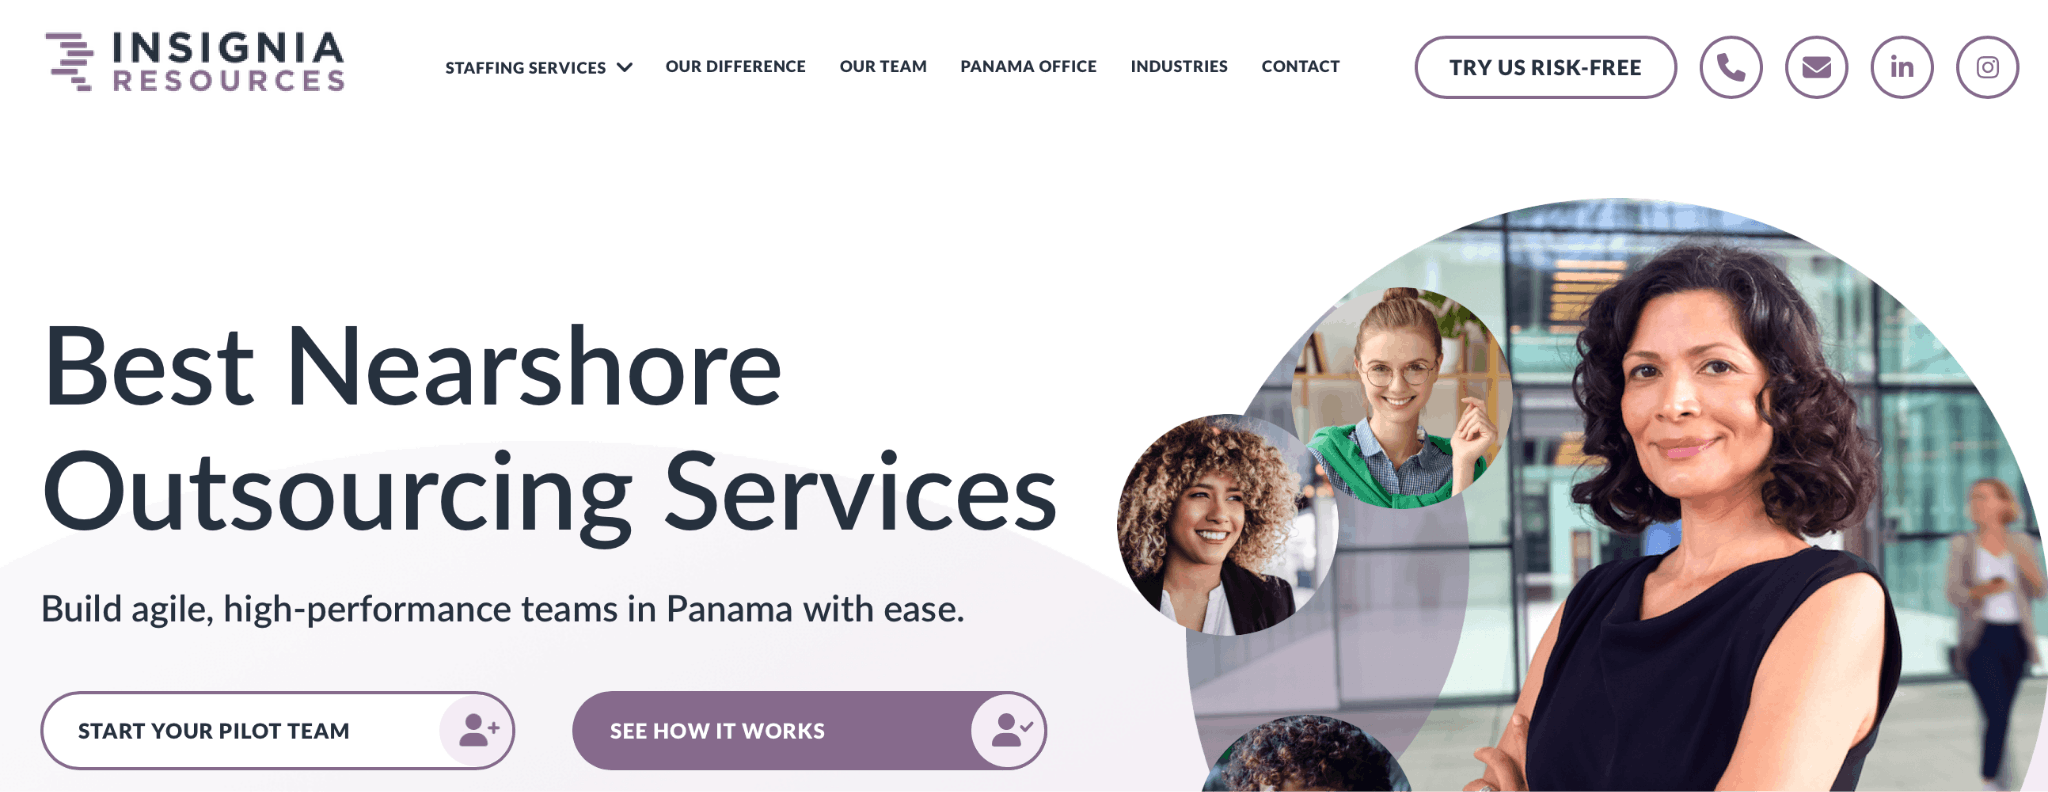
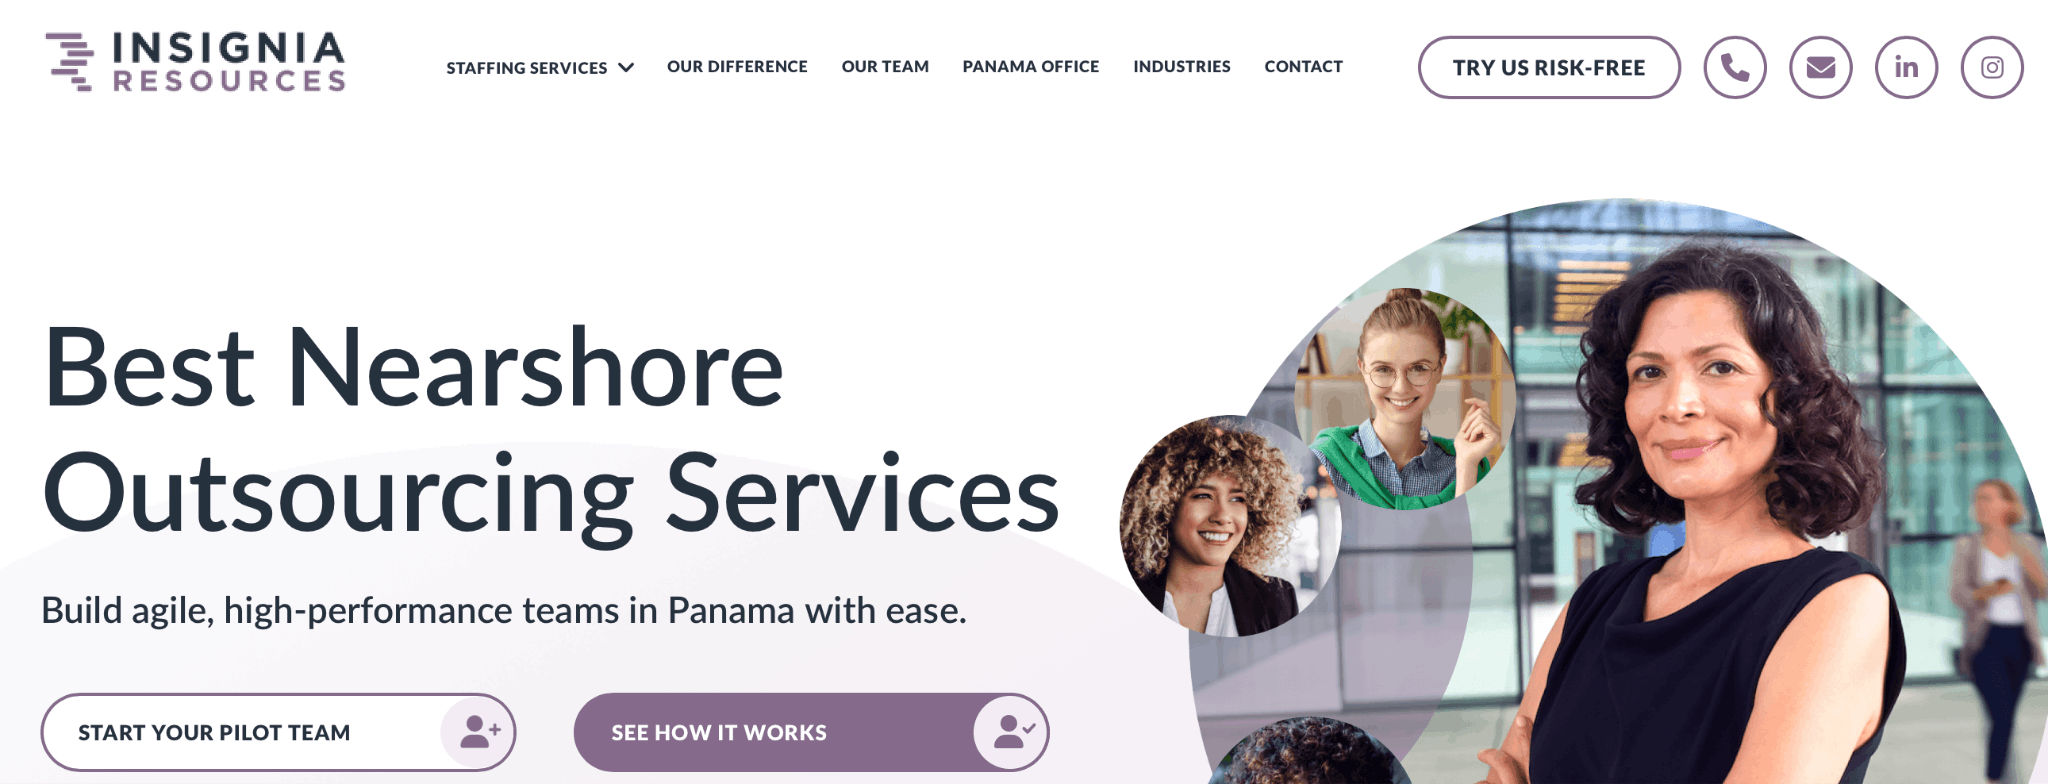
1. Insignia Resources
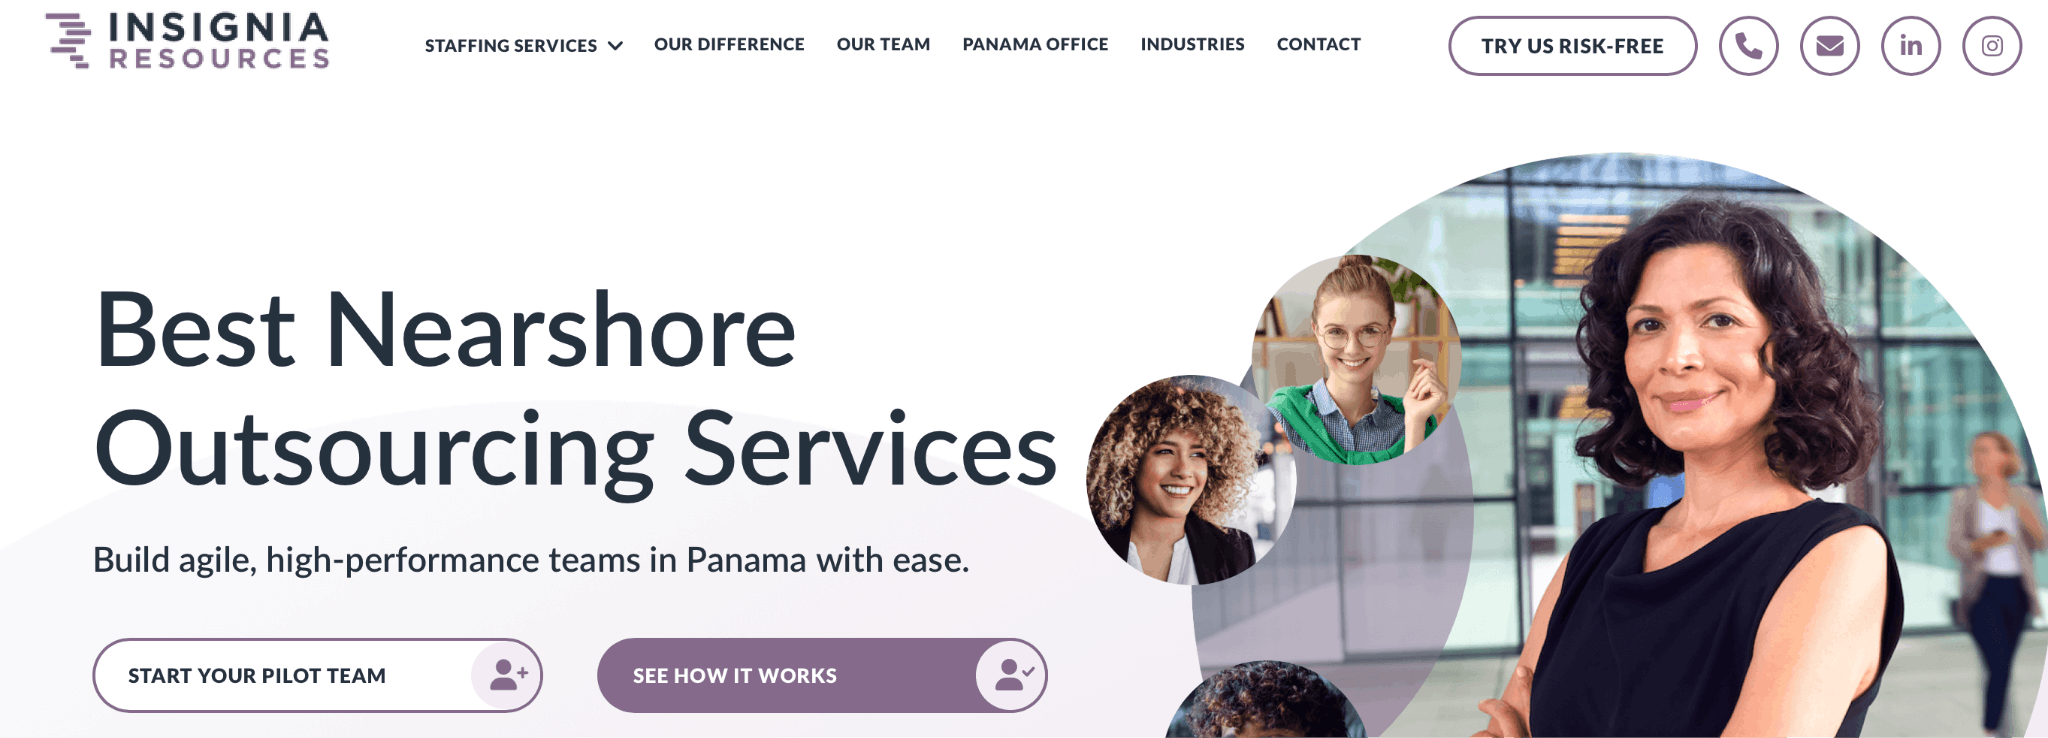
Insignia Resources leads the industry with a U.S.-managed, Panama-based delivery model that combines American oversight with nearshore cost savings. Founded in 2018, the company provides payroll, benefits administration, compliance, and recruiting services while offering same-time-zone support and 40–60% lower costs than domestic providers.
- Operates in the same time zone as U.S. businesses for real-time collaboration
- GAAP-compliant processes ensure regulatory adherence
- Highly educated bilingual professionals integrate seamlessly with client teams
- Advanced HRIS platforms with robust reporting capabilities
- Proactive compliance monitoring and risk mitigation
| Summary of Online Reviews |
|---|
| Clients praise Insignia Resources for “exceptional in responsiveness” and delivering “seamless system integration.” Customers consistently appreciate that the team functions as “a true extension of internal teams rather than an external vendor.” |
2. ADP TotalSource
ADP TotalSource combines 75+ years of experience with comprehensive PEO services for mid-to-large businesses. Its CPEO certification, nationwide scale, and enterprise-grade technology provide strong compliance support, multi-state expertise, and competitive employee benefits.
- IRS-certified PEO status provides added client protections
- Extensive compliance resources with proactive legislative updates
- Fortune 500-level benefits through master health plans
- Advanced analytics and benchmarking through ADP DataCloud
- Dedicated HR Business Partner support model
| Summary of Online Reviews |
|---|
| Users describe ADP TotalSource as “reliable payroll processing” and “comprehensive HR tools.” Clients appreciate “dedicated HR support” and the platform’s ability to handle “all employee benefits in one place.” |
3. TriNet
TriNet specializes in providing industry-specific HR solutions for growth-stage companies. With particular strength in compliance management and risk mitigation, TriNet serves businesses in highly regulated sectors including technology, life sciences, and financial services. Their IRS-certified PEO status and cloud-based platform offer strong integration capabilities with dedicated account management for strategic HR guidance.
- Industry-tailored support teams with vertical expertise
- IRS-certified PEO providing regulatory credibility
- Per-employee-per-month pricing for budget predictability
- Multi-state compliance capabilities
- Comprehensive risk management and workers’ compensation support
| Summary of Online Reviews |
|---|
| Clients say TriNet provides “user-friendly navigation” and “multitude of features.” However, some mention concerns about “noncompetitive pricing” and “frequent hidden fees.” |
4. Paychex
Paychex serves nearly 800,000 clients with streamlined payroll and HR services built for simplicity and reliability. The Paychex Flex platform provides scalable solutions that grow with businesses, particularly suited for smaller companies. With over 50 years in business, Paychex focuses on making complex administrative tasks manageable through intuitive technology and consistent processing.
- User-friendly Paychex Flex platform
- Strong payroll processing foundation
- Scalable solutions for growing businesses
- Assigned support specialists for personalized service
- Extensive client base demonstrating market trust
| Summary of Online Reviews |
|---|
| Users highlight Paychex as “truly a professional organization” with “top-notch benefits.” Clients note the platform houses “supporting tools” that make processes easier. |
5. Insperity
Insperity provides full-service HR solutions with over 30 years of experience serving businesses with 5-1,000 employees. Their consultative approach emphasizes personalized service through dedicated specialist teams. The company’s strength lies in providing hands-on strategic HR guidance, though pricing tends to be higher than that of technology-focused competitors.
- Dedicated specialist teams for benefits, payroll, and compliance
- Fortune 500-level benefits packages
- Comprehensive talent management and training libraries
- Regional support with local expertise
- Risk management and safety program development
| Summary of Online Reviews |
|---|
| Positive reviews note Insperity’s “excellent benefits package” was “a huge step up” with “proactive support” that is “always one step ahead.” However, critics cite “monthly service fees are THOUSANDS of dollars higher” than alternatives. |
6. Gusto
Gusto has established itself as a leading HR platform for small to medium-sized businesses through its intuitive cloud-based system. The company emphasizes user experience and modern technology with self-service capabilities. While excelling in technology and ease of use, Gusto’s service model offers less hands-on support than traditional PEO providers.
- Modern, intuitive user interface
- Transparent, affordable pricing for small businesses
- 24/7 customer support via multiple channels
- Comprehensive onboarding and benefits enrollment tools
- Strong mobile app functionality
| Summary of Online Reviews |
|---|
| Users describe Gusto as “awesome” and “best HR Software there is.” Clients appreciate “intuitive interface” and “excellent customer support.” One reviewer noted it’s “very easy to use and navigate.” |
7. Justworks
Justworks provides PEO services with particular strength in benefits administration and compliance support for businesses with 5-500 employees. Their transparent pricing and comprehensive benefits packages attract companies prioritizing employee perks. The platform offers solid technology and responsive customer service, though geographic coverage and industry expertise remain more limited than larger competitors.
- Transparent, publicly available pricing
- Excellent benefits options and carrier relationships
- 24/7 customer support availability
- Modern, easy-to-use platform
- Straightforward onboarding process
| Summary of Online Reviews |
|---|
| Clients value Justworks for “exemplary PEO services” with “excellent customer service.” Users say “the platform is easy to set up.” Reviews highlight “great product and great customer service” with systems that are “easy for employees to manage.” |
8. Bambee
Bambee specializes in providing dedicated HR managers and compliance support to small businesses at an affordable price. Their model focuses on ongoing HR guidance and policy development rather than full administrative outsourcing. This approach suits companies wanting to maintain some internal HR control while ensuring regulatory compliance and professional guidance.
- Dedicated HR manager for personalized support
- Affordable pricing starting at $299/month
- Customizable policy templates and handbook development
- Focus on compliance and liability reduction
- Accessible via chat, email, and phone
| Summary of Online Reviews |
|---|
| Positive reviews note Bambee representatives are “very easy to use” and “keeping us up to date and updating employee files.” However, some report “inconsistent communication” and “system glitches.” |
Best HR Outsourcing for Mid-Sized Companies
For businesses with 50 to 500 employees requiring sophisticated HR support with strategic guidance:
| Rank | Provider |
|---|---|
| 1 | Insignia Resources |
| 2 | ADP TotalSource |
| 3 | TriNet |
| 4 | Insperity |
Best PEO Services for Compliance-Driven Industries
For businesses in highly regulated sectors requiring specialized compliance expertise:
| Rank | Provider |
|---|---|
| 1 | TriNet |
| 2 | Insignia Resources |
| 3 | ADP TotalSource |
| 4 | Insperity |
To request a copy of this list in PDF format, contact us here.